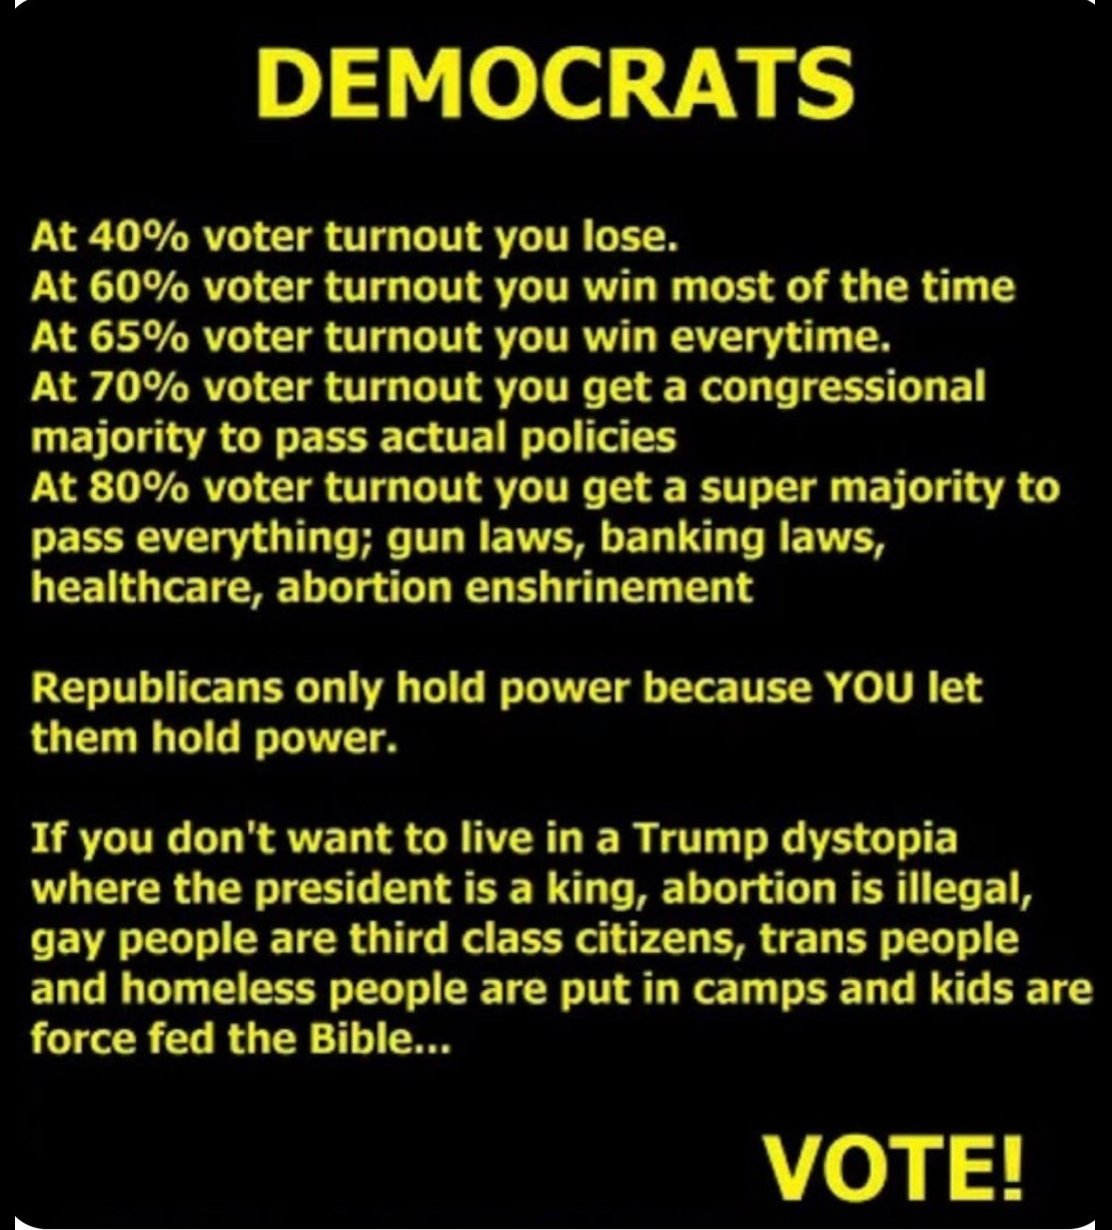
this post was submitted on 09 Oct 2024
1540 points (95.2% liked)
Political Memes
5487 readers
2640 users here now
Welcome to politcal memes!
These are our rules:
Be civil
Jokes are okay, but don’t intentionally harass or disturb any member of our community. Sexism, racism and bigotry are not allowed. Good faith argumentation only. No posts discouraging people to vote or shaming people for voting.
No misinformation
Don’t post any intentional misinformation. When asked by mods, provide sources for any claims you make.
Posts should be memes
Random pictures do not qualify as memes. Relevance to politics is required.
No bots, spam or self-promotion
Follow instance rules, ask for your bot to be allowed on this community.
founded 1 year ago
MODERATORS
you are viewing a single comment's thread
view the rest of the comments
view the rest of the comments

Sources please
I listed the sources. If you can't manage the independent volition to do a simple Google search, than I'm afraid you're simply going to have to remain ignorant.
Where? I do not see a single source. I see you referencing that such sources exist somewhere, but I fail to see any titles, authors, or web links to actually provide a specific source.
The author and agencies are listed. It's not my responsibility to do the labor of educating you further than I already have. If you need to be hand fed links, then you're going to remain exactly as you are. I've already put enough time into the post. This is close enough to sealioning in my estimation for me to block you. Good luck.
I am not sure how to find this. I actually already looked at a Pew article earliee today and didn't happen to see it there.
I'll link it again and look through it again to see if it's there.
Further, your second point is lacking any source including an author.
Last, whatever source you're quoting specifically important because I'm highly curious what the verbiage actually is. There is a world of difference between someone who "leans" Republican versus someone who will never vote Democrat.
Eta, from above Pew source:
Perhaps if Dems were able to pass easier mail in voting or better legislation generally, people would be more likely to vote for them