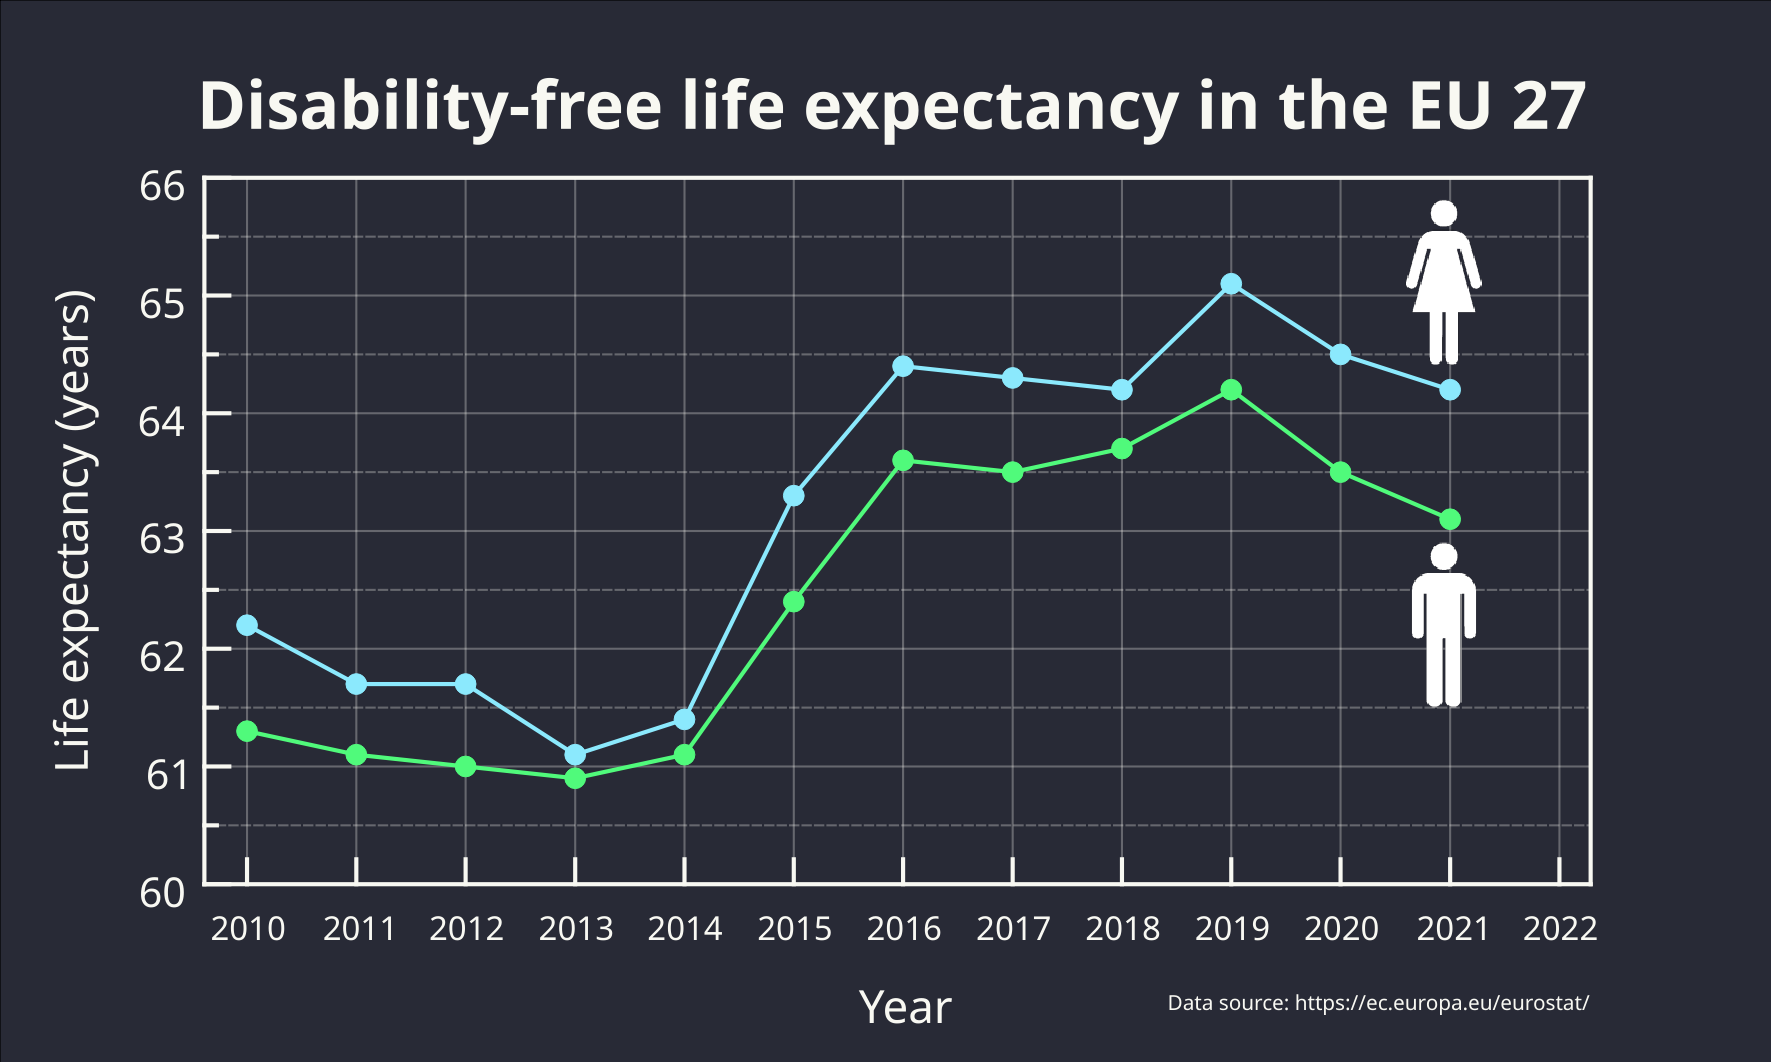
Disability-free life expectancy in the EU 27
@dataisbeautiful
!health@lemmy.world
!labplot@lemmy.kde.social
LabPlot ❤️ Data
#DataViz #Statistics #Visualization #Health #Disability #LabPlot #OpenSource #FOSS #DraculaTheme
A place to share and discuss data visualizations. #dataviz
(under new moderation as of 2024-01, please let me know if there are any changes you want to see!)
Disability-free life expectancy in the EU 27
@dataisbeautiful
!health@lemmy.world
!labplot@lemmy.kde.social
LabPlot ❤️ Data
#DataViz #Statistics #Visualization #Health #Disability #LabPlot #OpenSource #FOSS #DraculaTheme
@dataisbeautiful
The process average X and control limits are added to the plot for men. The average is 63.4. The upper control limit (UCL) is 64.8 and the lower control limit (LCL) is 62.0.
The UCL represents the largest value you would expect if you only have common causes of variation present. The LCL represents the smallest value you would expect if you only have common causes of variation present.
➡️ https://en.wikipedia.org/wiki/Control_chart
#DataViz #Statistics #Health #LabPlot #SPC #OpenSource