this post was submitted on 18 Aug 2024
501 points (97.4% liked)
Data is Beautiful
4947 readers
150 users here now
A place to share and discuss visual representations of data: Graphs, charts, maps, etc.
DataIsBeautiful is for visualizations that effectively convey information. Aesthetics are an important part of information visualization, but pretty pictures are not the sole aim of this subreddit.
A place to share and discuss visual representations of data: Graphs, charts, maps, etc.
  A post must be (or contain) a qualifying data visualization.

  Directly link to the original source article of the visualization
    Original source article doesn't mean the original source image. Link to the full page of the source article as a link-type submission.
    If you made the visualization yourself, tag it as [OC]

  [OC] posts must state the data source(s) and tool(s) used in the first top-level comment on their submission.

  DO NOT claim "[OC]" for diagrams that are not yours.

  All diagrams must have at least one computer generated element.

  No reposts of popular posts within 1 month.

  Post titles must describe the data plainly without using sensationalized headlines. Clickbait posts will be removed.

  Posts involving American Politics, or contentious topics in American media, are permissible only on Thursdays (ET).

  Posts involving Personal Data are permissible only on Mondays (ET).
Please read through our FAQ if you are new to posting on DataIsBeautiful. Commenting Rules
Don't be intentionally rude, ever.

Comments should be constructive and related to the visual presented. Special attention is given to root-level comments.

Short comments and low effort replies are automatically removed.

Hate Speech and dogwhistling are not tolerated and will result in an immediate ban.

Personal attacks and rabble-rousing will be removed.

Moderators reserve discretion when issuing bans for inappropriate comments. Bans are also subject to you forfeiting all of your comments in this community.
Originally r/DataisBeautiful
founded 1 year ago
MODERATORS
you are viewing a single comment's thread
view the rest of the comments
view the rest of the comments

I wonder how much of a role palate refinement is for this trend. For example: Starbucks, for as terrible as their coffee is, did a lot to elevate the overall regard of coffee; bean juice was no longer just a bitter stew we tolerated to get our caffeine fix. Starbucks broke trail for craft coffee roasting more general popularity.
Could it be the same with alcoholic beverages? I used to think Maker's Mark was the best bourbon going. Now I know better, but so many of the craft bourbons are expensive or just plain hard to find. Ditto for my favorite hazy IPAs. Why binge drink the good stuff when your palate is going to be wrecked after three beers? And since I'm not going to drink swill, welp, guess I'm not going to get drunk tonight!
edit : I guess I should learn to read
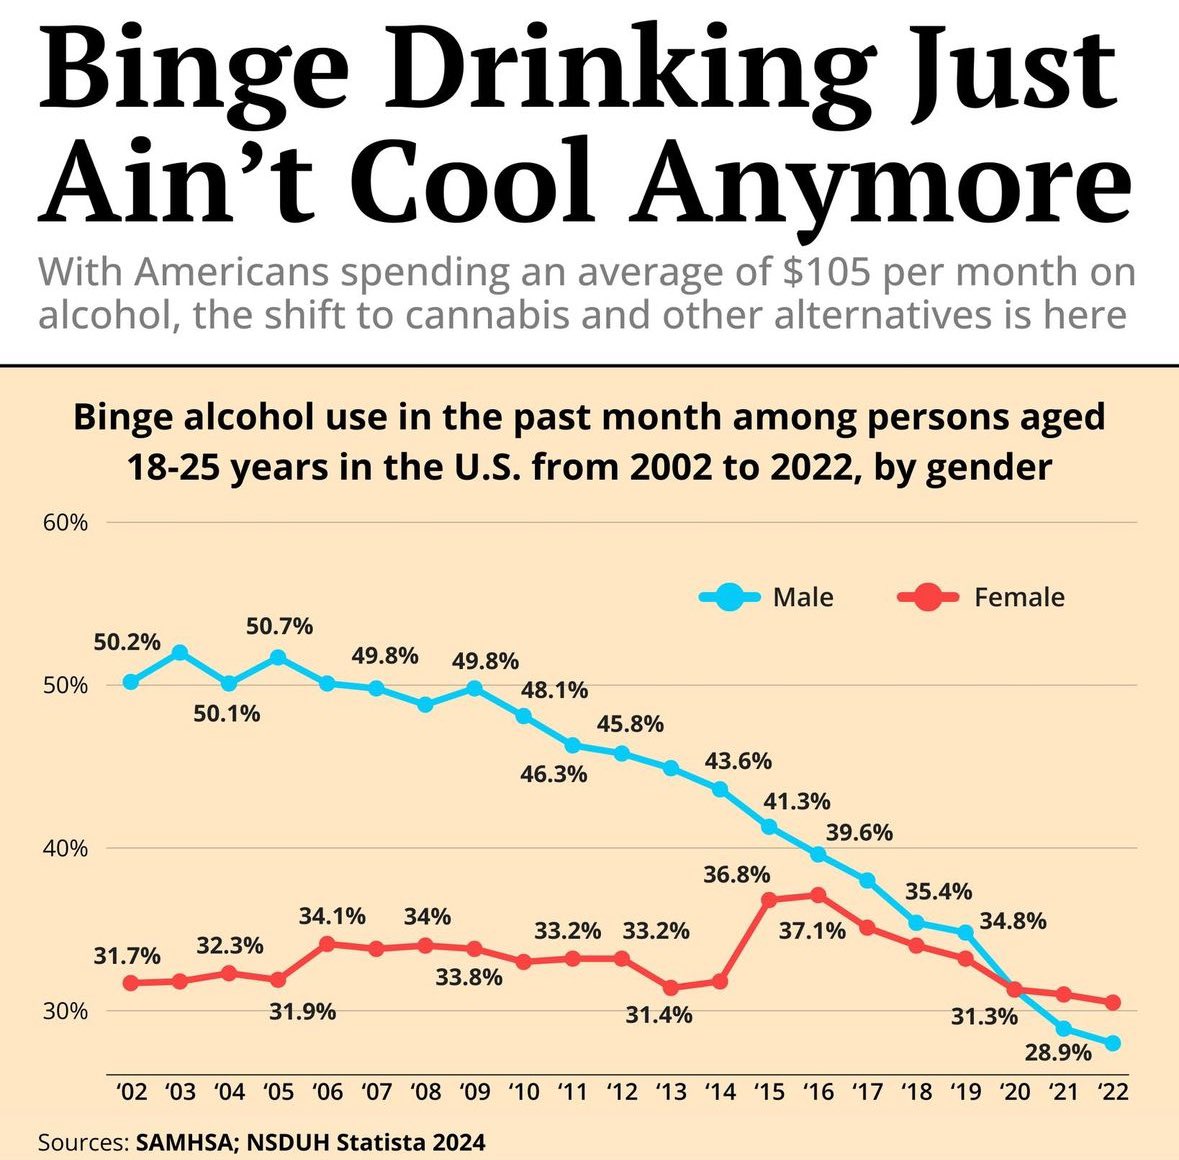
Except the graph only covers 18-25 year olds. Those who aged out simply stopped being included in the reported population of this graph.
Naltrexone helps for anyone already seeing the doctor to curb the drinking urges.
Getting prescribed ER Adderall has done wonders for my other addictions lol.
No, that's not how the graph works. It isn't following one generational cohort as they age; it's measuring the behavior of a certain age group and switching to new people as they age out.
It's only measuring the second part of what you wrote.
Used to work in the industry. The common joke was that Starbucks is a dairy business with a side coffee business. They move a hell of a lot of dairy. They had word-of-mouth and an insatiable appetite to fill every strip mall. I wouldn't say their coffee was ever good or great. It just had to be better than McDonalds which is not saying much. Good business plan though.